Using Perfetto in ZJIT
Originally published on Rails At Scale.
Look! A trace of slow events in a benchmark! Hover over the image to see it get bigger.
Now read on to see what the slow events are and how we got this pretty picture.
The rules
The first rule of just-in-time compilers is: you stay in JIT code. The second rule of JIT is: you STAY in JIT code!
When control leaves the compiled code to run in the interpreter—what the ZJIT team calls either a “side-exit” or a “deopt”, depending on who you talk to—things slow down. In a well-tuned system, this should happen pretty rarely. Right now, because we’re still bringing up the compiler and runtime system, it happens more than we would like.
We’re reducing the number of exits over time.
Lies, damned lies, and statistics
We can track our side-exit reduction progress with --zjit-stats, which,
on process exit, prints out a tidy summary of the counters for all of the bad
stuff we track. It’s got side-exits. It’s got calls to C code. It’s got calls
to slow-path runtime helpers. It’s got everything.
Here is a chopped-up sample of stats output for the Lobsters benchmark, which is a large Rails app:
$ WARMUP_ITRS=0 MIN_BENCH_ITRS=20 MIN_BENCH_TIME=0 ruby --zjit-stats benchmarks/lobsters/benchmark.rb
...
***ZJIT: Printing ZJIT statistics on exit***
...
Top-20 side exit reasons (100.0% of total 12,549,876):
                   guard_type_failure: 6,020,734 (48.0%)
                  guard_shape_failure: 5,556,147 (44.3%)
  block_param_proxy_not_iseq_or_ifunc:   445,358 ( 3.5%)
                   unhandled_hir_insn:   215,168 ( 1.7%)
                        compile_error:   181,474 ( 1.4%)
...
compiled_iseq_count:                               5,581
failed_iseq_count:                                     2
compile_time:                                    1,443ms
...
guard_type_count:                            133,425,094
guard_type_exit_ratio:                              4.5%
guard_shape_count:                            49,386,694
guard_shape_exit_ratio:                            11.3%
...
code_region_bytes:                            31,571,968
side_exit_size_ratio:                              33.1%
zjit_alloc_bytes:                             19,329,659
total_mem_bytes:                              50,901,627
...
ratio_in_zjit:                                     82.8%
$
(I’ve cut out significant chunks of the stats output and replaced them with
... because it’s overwhelming the first time you see it.)
The first thing you might note is that the thing I just described as terrible for performance is happening over twelve million times. The second thing you might notice is that despite this, we’re staying in JIT code seemingly a high percentage of the time. Or are we? Is 80% high? Is a 4.5% class guard miss ratio high? What about 11% for shapes? It’s hard to say.
The counters are great because they’re quick and they’re reasonably stable proxies for performance. There’s no substitute for painstaking measurements on a quiet machine but if the counter for Bad Slow Thing goes down (and others do not go up), we’re probably doing a good job.
But they’re not great for building intuition. For intuition, we want more tangible feeling numbers. We want to see things.
Building intuition
The third thing is that you might ask yourself “self, where are these exits coming from?” Unfortunately, counters cannot tell you that. For that, we want stack traces. This lets us know where in the guest (Ruby) code triggers an exit.
Ideally also we would want some notion of time: we would want to know not just where these events happen but also when. Are the exits happening early, at application boot? At warmup? Even during what should be steady state application time? Hard to say.
So we need more tools. Thankfully, Perfetto exists. Perfetto is a system for visualizing and analyzing traces and profiles that your application generates. It has both a web UI and a command-line UI.
We can emit traces for Perfetto and visualize them there.
A look at Perfetto
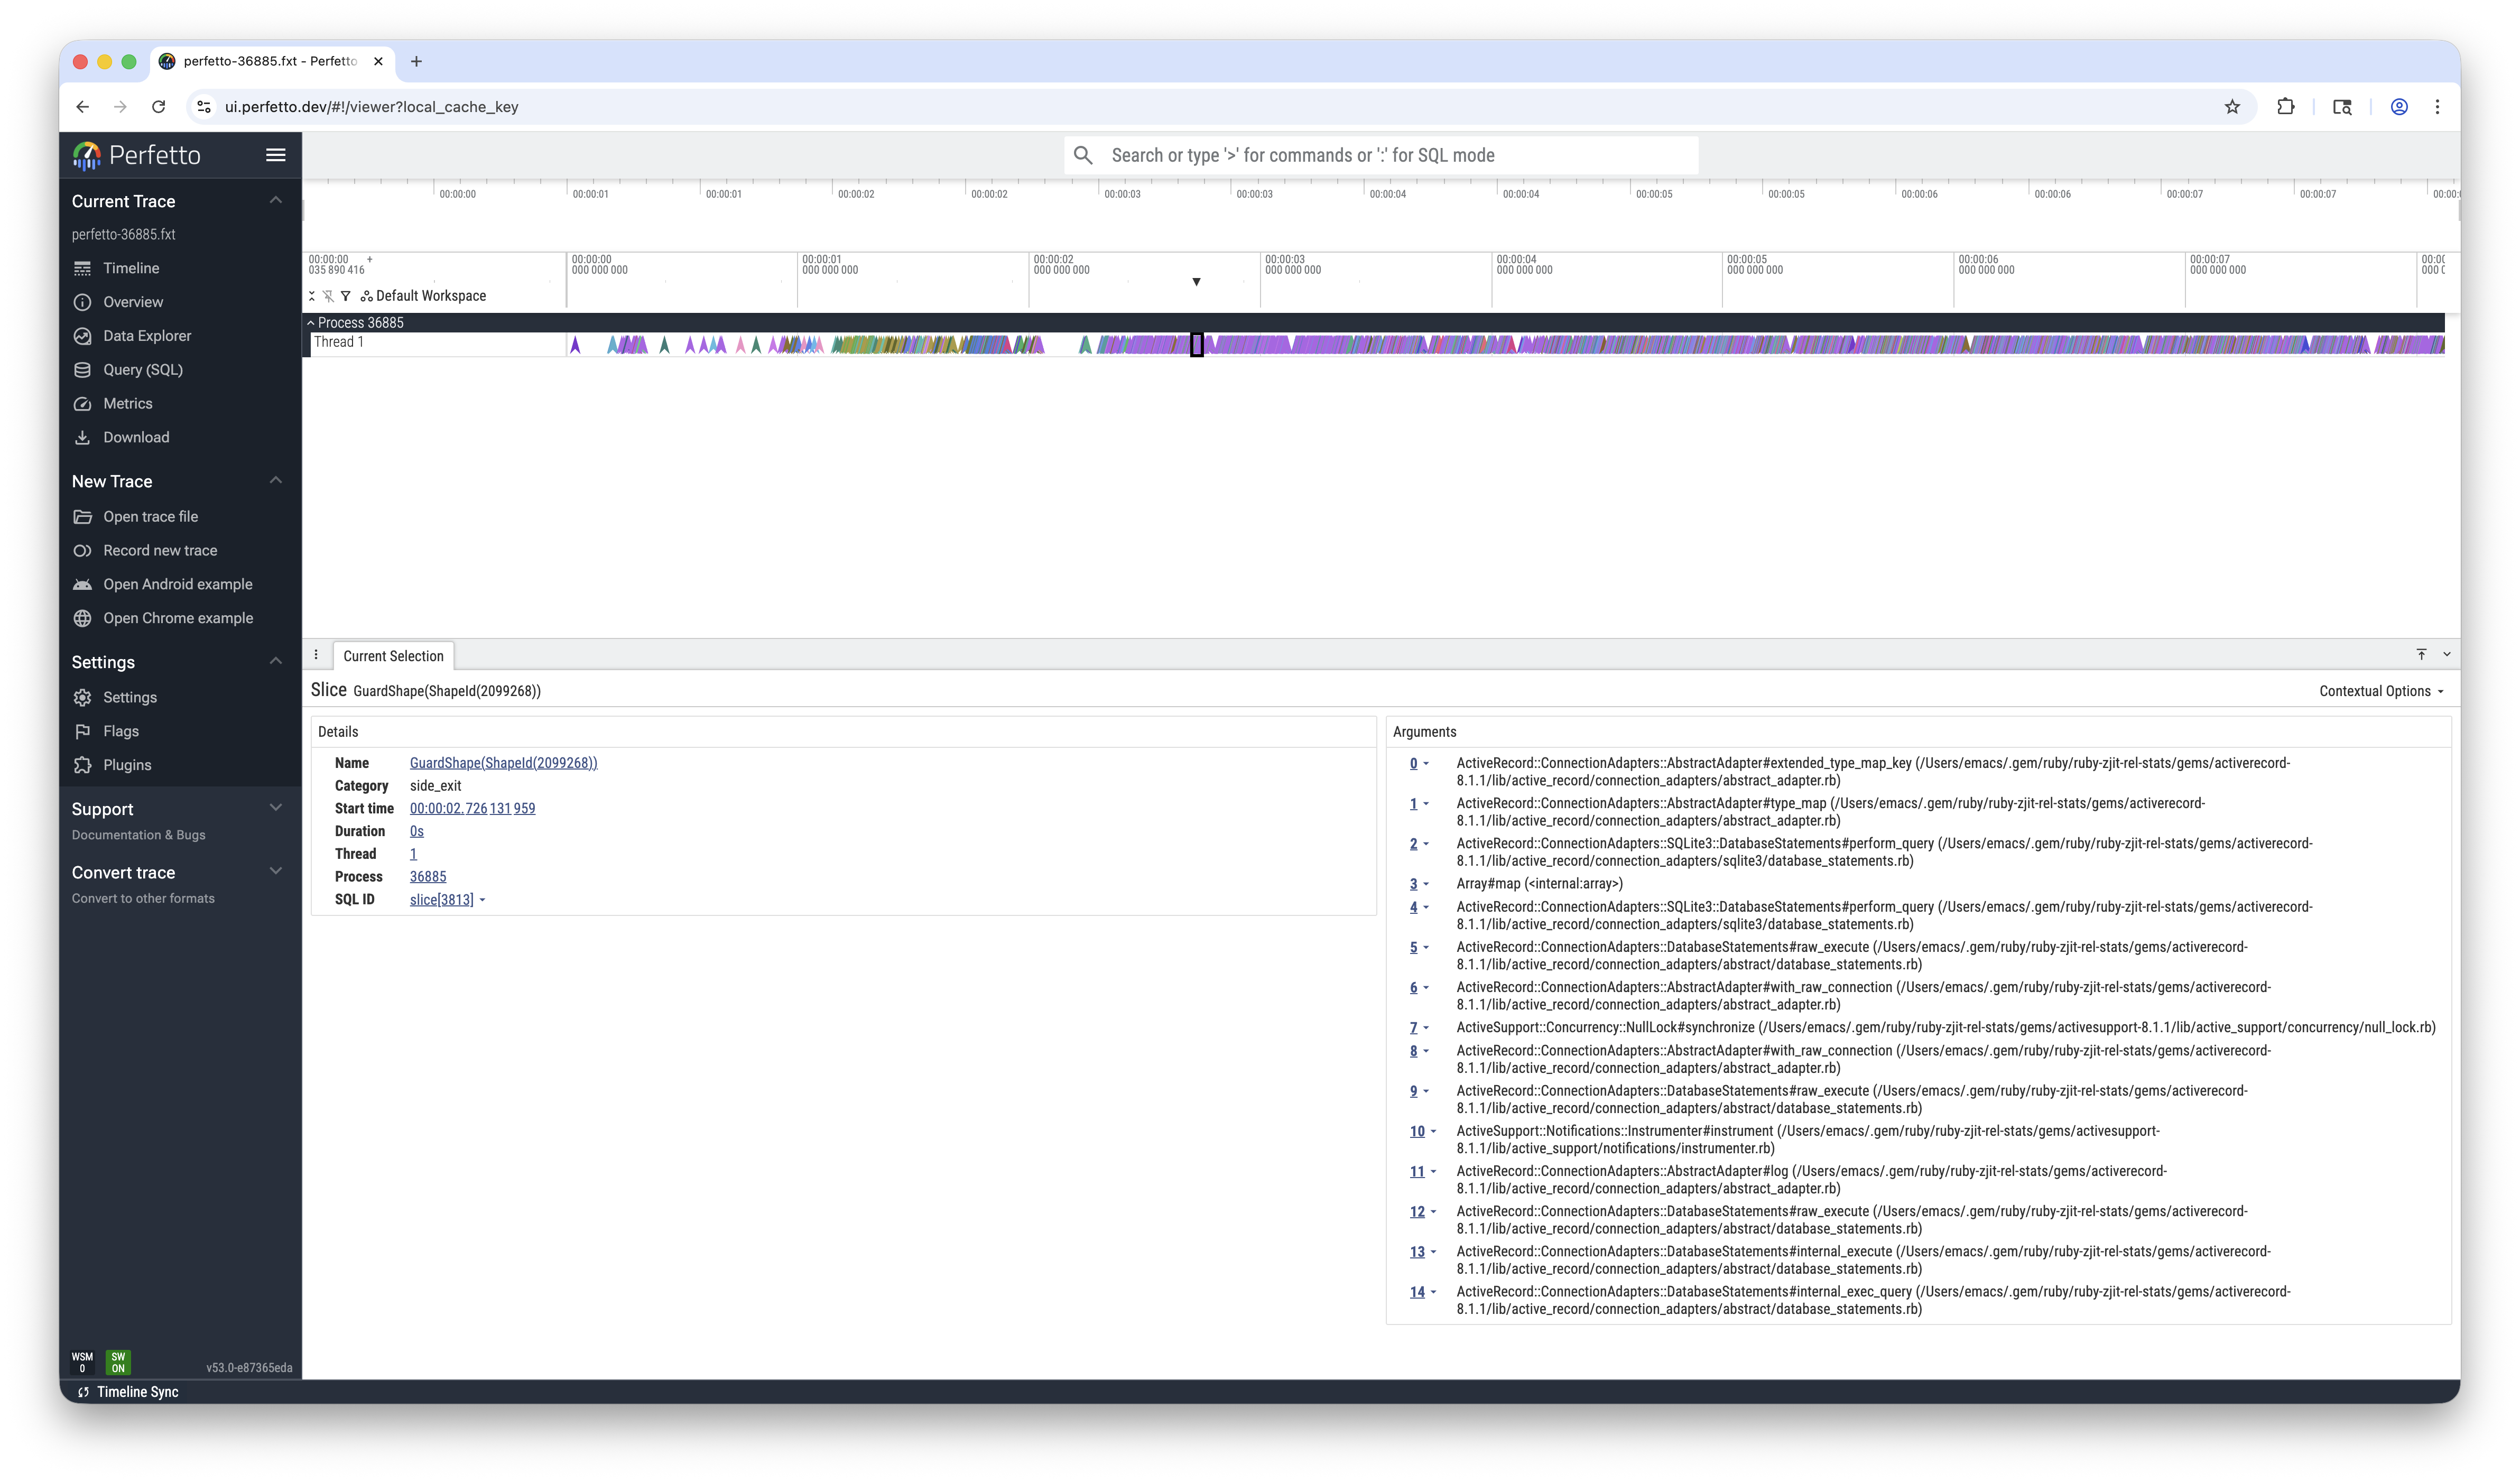
Take a look at this sample ZJIT Perfetto
trace
generated by running Ruby with --zjit-trace-exits1. What do you see?
I see a couple arrows on the left. Arrows indicate “instant” point-in-time events. Then I see a mess of purple to the right of that until the end of the trace.
Hover over an arrow. Find out that each arrow is a side-exit. Scream silently.
But it’s a friendly arrow. It tells you what the side-exit reason is. If you click it, it even tells you the stack trace in the pop-up panel on the bottom. If we click a couple of them, maybe we can learn more.
We can also zoom by mousing over the track, holding Ctrl, and scrolling. That will get us look closer. But there are so many…
Fortunately, Perfetto also provides a SQL interface to the traces. We can write
a query to aggregate all of the side exit events from the slice table and
line them up with the topmost method from the backtrace arguments in the args
table:
SELECT
  s.name AS reason,
  a.display_value AS method,
  COUNT(*) AS count
FROM slice s
JOIN args a ON a.arg_set_id = s.arg_set_id AND a.key = '0'
GROUP BY s.name, a.display_value
ORDER BY count DESC
This pulls up a query box at the bottom showing us that there are a couple big hotspots:
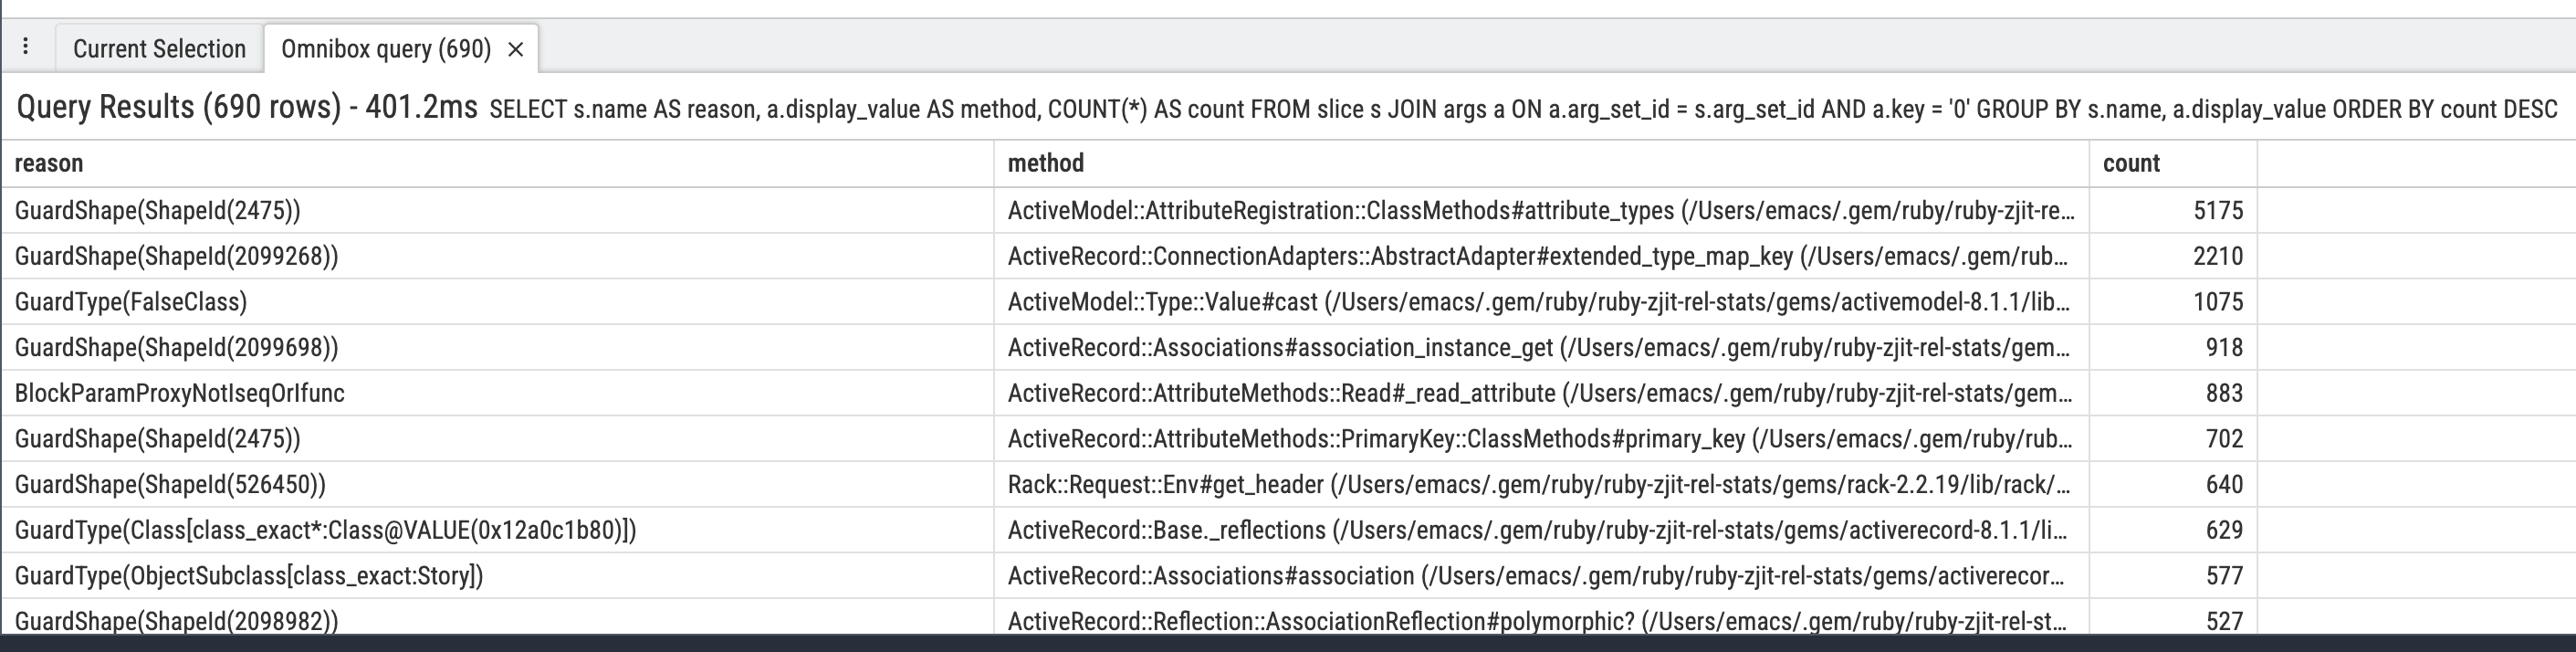
It even has a helpful option to export the results Markdown table so I can paste (an edited version) into this blog post:
| reason | method | count |
|---|---|---|
| GuardShape(ShapeId(2475)) | ActiveModel::AttributeRegistration::ClassMethods#attribute_types | 5119 |
| GuardShape(ShapeId(2099268)) | ActiveRecord::ConnectionAdapters::AbstractAdapter#extended_type_map_key | 2295 |
| GuardType(FalseClass) | ActiveModel::Type::Value#cast | 1025 |
| GuardShape(ShapeId(2099698)) | ActiveRecord::Associations#association_instance_get | 904 |
| BlockParamProxyNotIseqOrIfunc | ActiveRecord::AttributeMethods::Read#_read_attribute | 902 |
| GuardShape(ShapeId(526450)) | Rack::Request::Env#get_header | 636 |
| GuardType(Class[class_exact*:Class@VALUE(0x128c60100)]) | ActiveRecord::Base._reflections | 622 |
| GuardType(ObjectSubclass[class_exact:Story]) | ActiveRecord::Associations#association | 565 |
| GuardShape(ShapeId(2098982)) | ActiveRecord::Reflection::AssociationReflection#polymorphic? | 510 |
| GuardType(StringSubclass[class_exact:ActiveSupport::SafeBuffer]) | ActionView::OutputBuffer#<< | 500 |
| GuardShape(ShapeId(2475)) | ActiveRecord::AttributeMethods::PrimaryKey::ClassMethods#primary_key | 492 |
| GuardType(ObjectSubclass[class_exact:ActiveModel::Type::String]) | ActiveModel::Type::Value#deserialize | 442 |
| GuardShape(ShapeId(2098982)) | ActiveRecord::Reflection::AssociationReflection#deprecated? | 376 |
| GuardType(ObjectSubclass[class_exact:Bundler::Dependency]) | Gem::Dependency#matches_spec? | 355 |
| UnhandledHIRInvokeBuiltin | Time#initialize | 346 |
Looks like we should figure out why we’re having shape misses so much and that will clear up a lot of exits. (Hint: it’s because once we make our first guess about what we think the object shape will be, we don’t re-assess… yet.)
This has been a taste of Perfetto. There’s probably a lot more to explore. Please join the ZJIT Zulip and let us know if you have any cool tracing or exploring tricks.
Now I’ll explain how you too can use Perfetto from your system. Adding support to ZJIT was pretty straightforward.
Implementation
The first thing is that you’ll need some way to get trace data out of your
system. We write to a file with a well-known location
(/tmp/perfetto-PID.fxt), but you could do any number of things. Perhaps you
can stream events over a socket to another process, or to a server that
aggregates them, or store them internally and expose a webserver that serves
them over the internet, or… anything, really.
Once you have that, you need a couple lines of code to emit the data. Perfetto accepts a number of formats. For example, in his excellent blog post, Tristan Hume opens with such a simple snippet of code for logging Chromium Trace JSON-formatted events (lightly modified by me):
event_name = ...
timestamp = ...
duration = ...
f = open('trace.json','a')
f.print("[")

# ... emit some events here ...

# Log a single event
f.print('{"name": "%s", "ts": %d, "dur": %d, "cat": "hi", "ph": "X", "pid": 1, "tid": 1, "args": {}},\n' %
  (event_name, timestamp, duration))

# ... emit some events here ...

# ... at process exit, close the file ...
f.print("]") # this closing ] isn't actually required
f.close()
This snippet is great. It shows, end-to-end, writing a stream of one event. It is a complete (X) event, as opposed to either:
- two discrete timestamped begin (B) and end (E) events that book-end something, or
- an instant (i) event that has no duration, or
- a couple other event types in the Chromium Trace Event Format doc
It was enough to get me started. Since it’s JSON, and we have a lot of side exits, the trace quickly ballooned to 8GB large for a several second benchmark. Not great. Now, part of this is our fault—we should side exit less—and part of it is just the verbosity of JSON.
Thankfully, Perfetto ingests more compact binary formats, such as the Fuchsia trace format. In addition to being more compact, FXT even supports string interning. After modifying the tracer to emit FXT, we ended with closer to 100MB for the same benchmark.
We can reduce further by sampling—not writing every exit to the trace, but
instead every K exits (for some (probably prime) K). This is why we provide
the --zjit-trace-exits-sample-rate=K option.
Check out the trace writer implementation from the point this article was written.
Tracing more things
We could trace:
- When methods get compiled
- How big the generated code is
- How long each compile phase takes
- When (and where) invalidation events happen
- When (and where) allocations happen from JITed code
- Garbage collection events
- and more!
Conclusion
Visualizations are awesome. Get your data in the right format so you can ask the right questions easily. Thanks for Perfetto!
Also, looks like visualizations are now available in Perfetto canary. Time to go make some fun histograms…
-
This is also sampled/strobed, so not every exit is in there. This is just 1/K of them for some K that I don’t remember. ↩